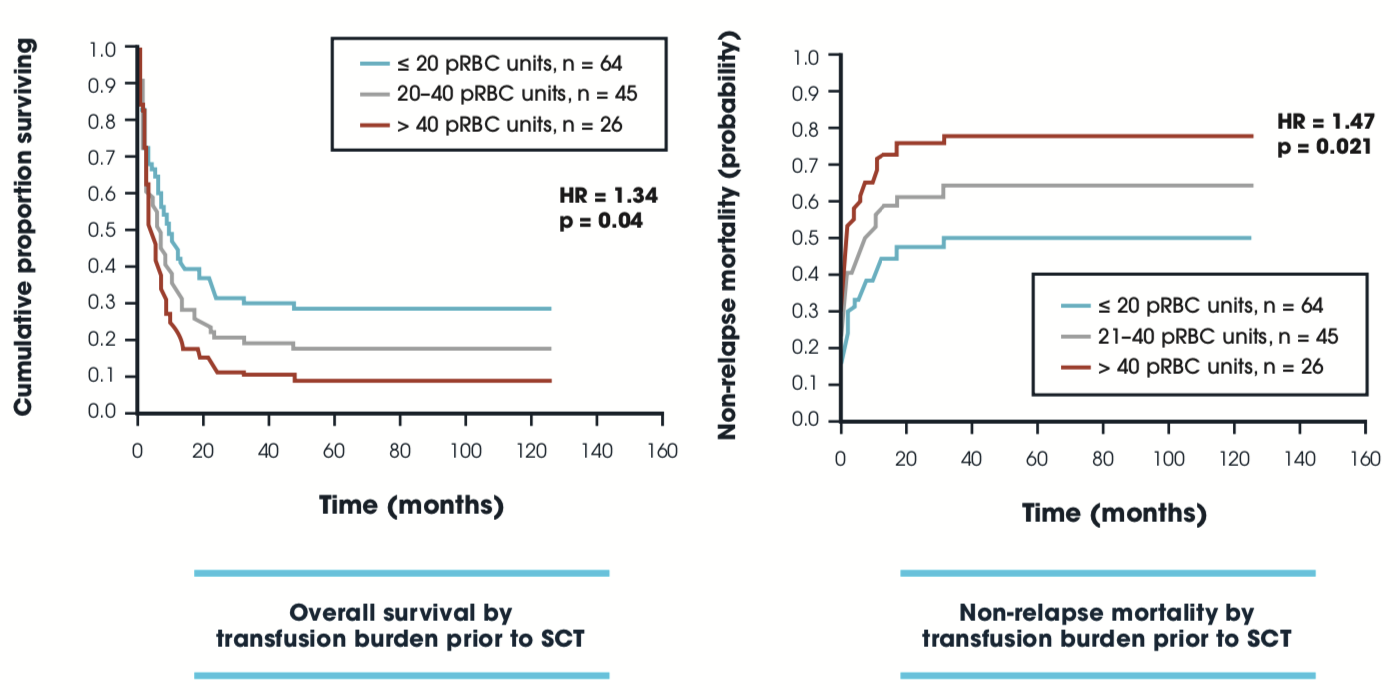
Impact of transfusion burden prior to SCT on OS & NRM post-SCT: GITMO
Patients with myeloid malignancies undergoing allo-SCT
| Table. Studies examining an impact of reducing IOL around SCT for hematologic malignancies. | ||||||||
|---|---|---|---|---|---|---|---|---|
| Time of intervention | Study type | SCT type | N | Disease type | IOL measure | Intervention | Endpoints | Reference |
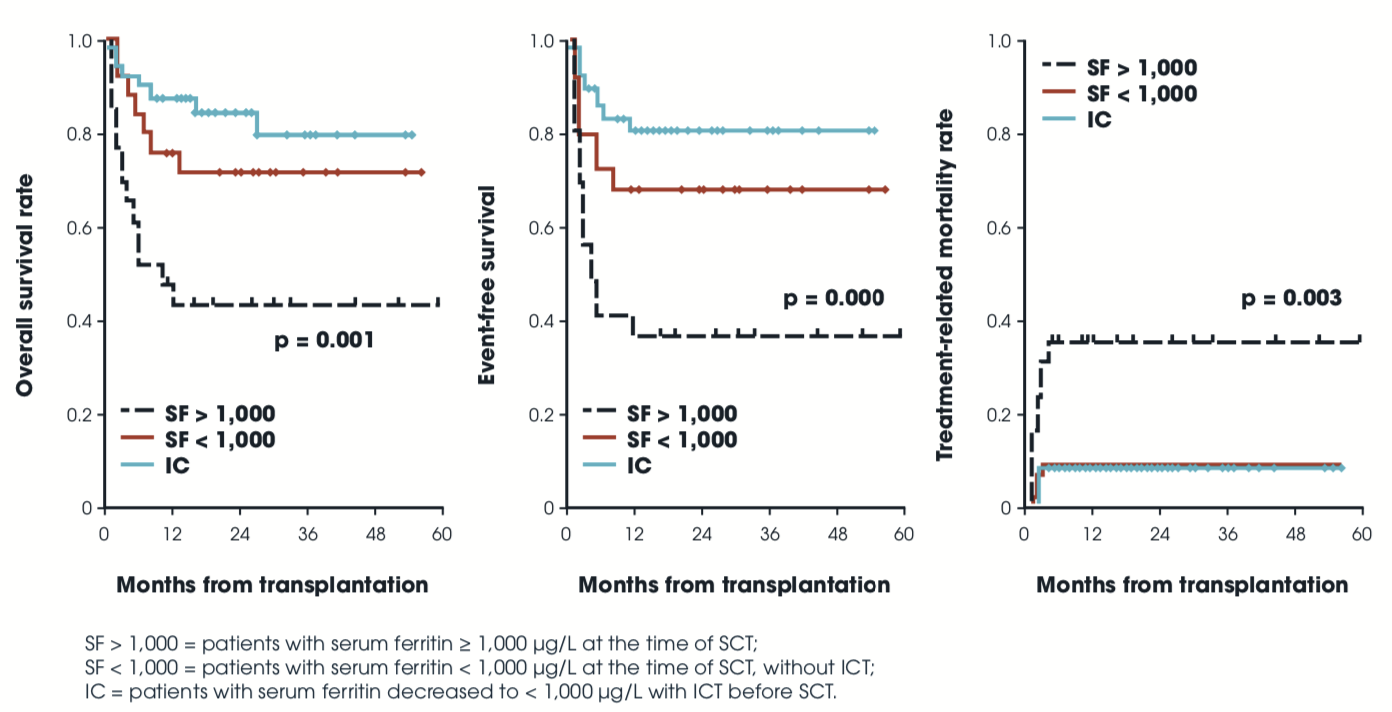
| Pre-SCT | Retro | Allo NOS | 101 | Multiple | Pre SF | DFO | TRM, EFS, OS p≤0.001 for all | Lee 2009 |
| Pre-SCT | Pro | MA | 5 | AML, MDS |
SF >1000 LIC >5 |
DFO | Closed for slow accrual | Armand 2013 |
| Post-SCT | Pro | Allo + ASCT | 10 | SF | Phleb | Improved LFT’s in most1 | McKay 1996 | |
| Post-SCT | Pro | Allo NOS | 38 | Multiple |
SF LIC by MRI |
Phleb (n=29) | 10/16 normalized AST/ALT | Rose 2007 |
| Post-SCT | Pro | Allo NOS | 20 | Multiple |
SF >1000 LIC by MRI |
Phleb |
SF decreased (p=0.0001) LIC decreased (p=0.0003) |
Kew 2015 |
| Post-SCT | Pro | MA, NMA | 23 | Multiple | LIC by MRI | Phleb (n=8), ICT (n=3) |
Phleb — liver disease (n=3), CHF (n=1), all improved ICT — all LIC improved Observation — 4 of 5 had decrease in SF over time |
Majhail 2010 |
| Post-SCT | Pro | MA, RIC | 42 | Multiple |
SF>1000 LIC by SQUID |
Phleb (n=19) |
LIC improved (p<0.001) LFT improved (p≤0.027) IFI, p=0.006 |
Busca 2010 |
| Post-SCT | NS | Allo NOS | 6 | Myeloid |
LIC by biopsy; severe IOL in 4 |
EPO-assisted phleb |
SF normal @ 11 mo LFT normal @ 7 mo 4 able to d/c IS for GVH |
Kamble 2006 |
| Post-SCT | Pro | Allo NOS | 23 | Multiple |
SF liver bx |
Phleb or DFO |
Improved SF Improved LFT’s |
Tomas 2000 |
| Post-SCT | NS | Allo NOS | 143 | Multiple |
SF >2000 no infection increased LFT LIC by MRI |
DFO |
MVA: DFO >2mo decreased RI (p=0.01) including in advanced disease (p=0.03) improved DFS (p=0.01) |
Kaloyannidis 2010 |
| Post-SCT | Pro | Allo NOS | 76 | AML, MDS2 |
SF >1000 CRP <10 |
DFX 10 mg/kg/d, adjusted; until SF <500 or EOS |
SF decreased (p<0.0001) 7.5 mg/kg/d best-tolerated AE similar to non-SCT |
Jaekel 2016 |
| Post-SCT | Pro | Allo NOS | 30 | Multiple | ≥6mo post SCT | DFX 10 mg/kg/d x52 wk or to normalized SF | AE as expected | Vallejo 2014 |
| Post-SCT | Retro | MA, NMA | 80 | Multiple | SF post ≥1000 | DFX vs phleb | MVA: OS favored DFX 0.023 | Sivgin 2013 |
| Post-SCT | Pro | Allo NOS | 8 | AL, AA |
Engrafted, Hb <LLN, TD |
DFX | Median time to TI 23d following start of DFX | Visani 2014 |
| 1numbers not given 2predominantly. AA, aplastic anemia; AE, adverse events; AL, acute leukemia; Allo, allogeneic; ALT, alanine aminotransferase; AML, acute myeloid leukemia; ASCT, autologous stem cell transplantation; AST, aspartate aminotransferase; bx, biopsy; CHF, congestive heart failure; CRP, C-reactive protein; d, days; d/c, discontinue; DFO, deferoxamine; DFS, disease-free survival; DFX, deferasirox; EFS, event-free survival; EOS, end of study; EPO, erythropoietin; GVH, graft versus host; Hb, hemoglobin; ICT, iron chelation therapy; IFI, invasive fungal infection; IOL, iron overload; IS, immunosuppression; LIC, liver iron concentration; LFT’s, liver function tests; LLN, lower limit of normal; MA, myeloablative; MDS, myelodysplastic syndrome; mo, months; MRI, magnetic resonance imaging; NMA, non-myeloablative; MVA, multivariate analysis; n, number; NOS, not otherwise specified; NS, not specified; OS, overall survival; phleb, phlebotomy; pro, prospective; retro, retrospective; RI, relapse incidence; RIC, reduced intensity conditioning; SCT, stem cell transplantation, SF, serum ferritin; SQUID, Superconducting Quantum Interference Device; TD, transfusion dependent; TI, transfusion independent; TRM, transplant-related mortality; wk, weeks. Leitch HA, et al. Crit Rev Oncol Hematol. 2017;113:156-170. | ||||||||
Iron chelation therapy prior to SCT improves survival (n=101)